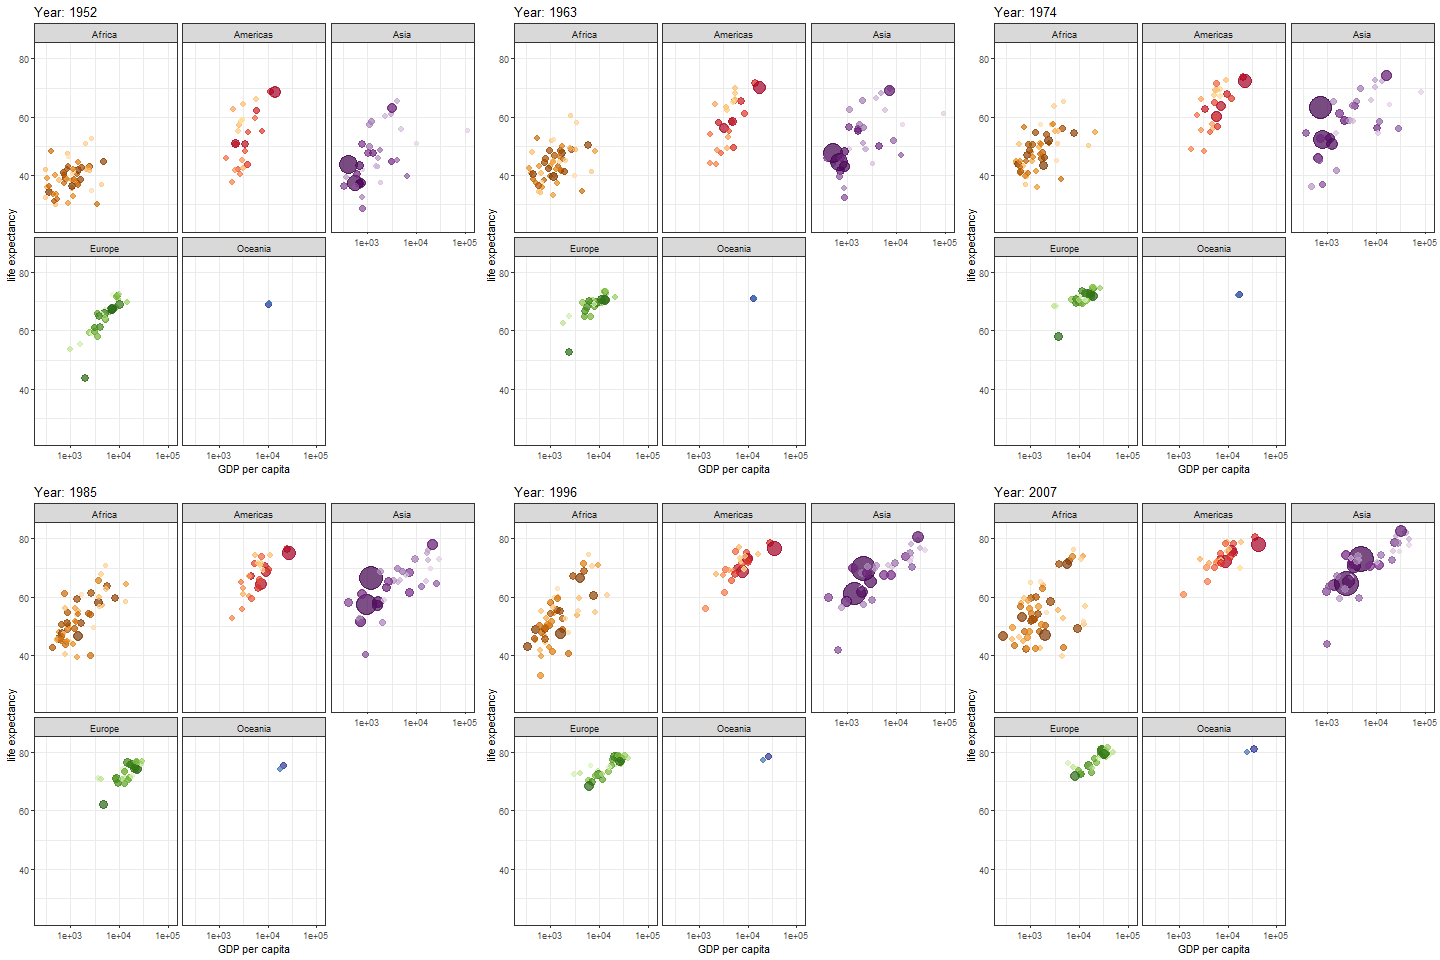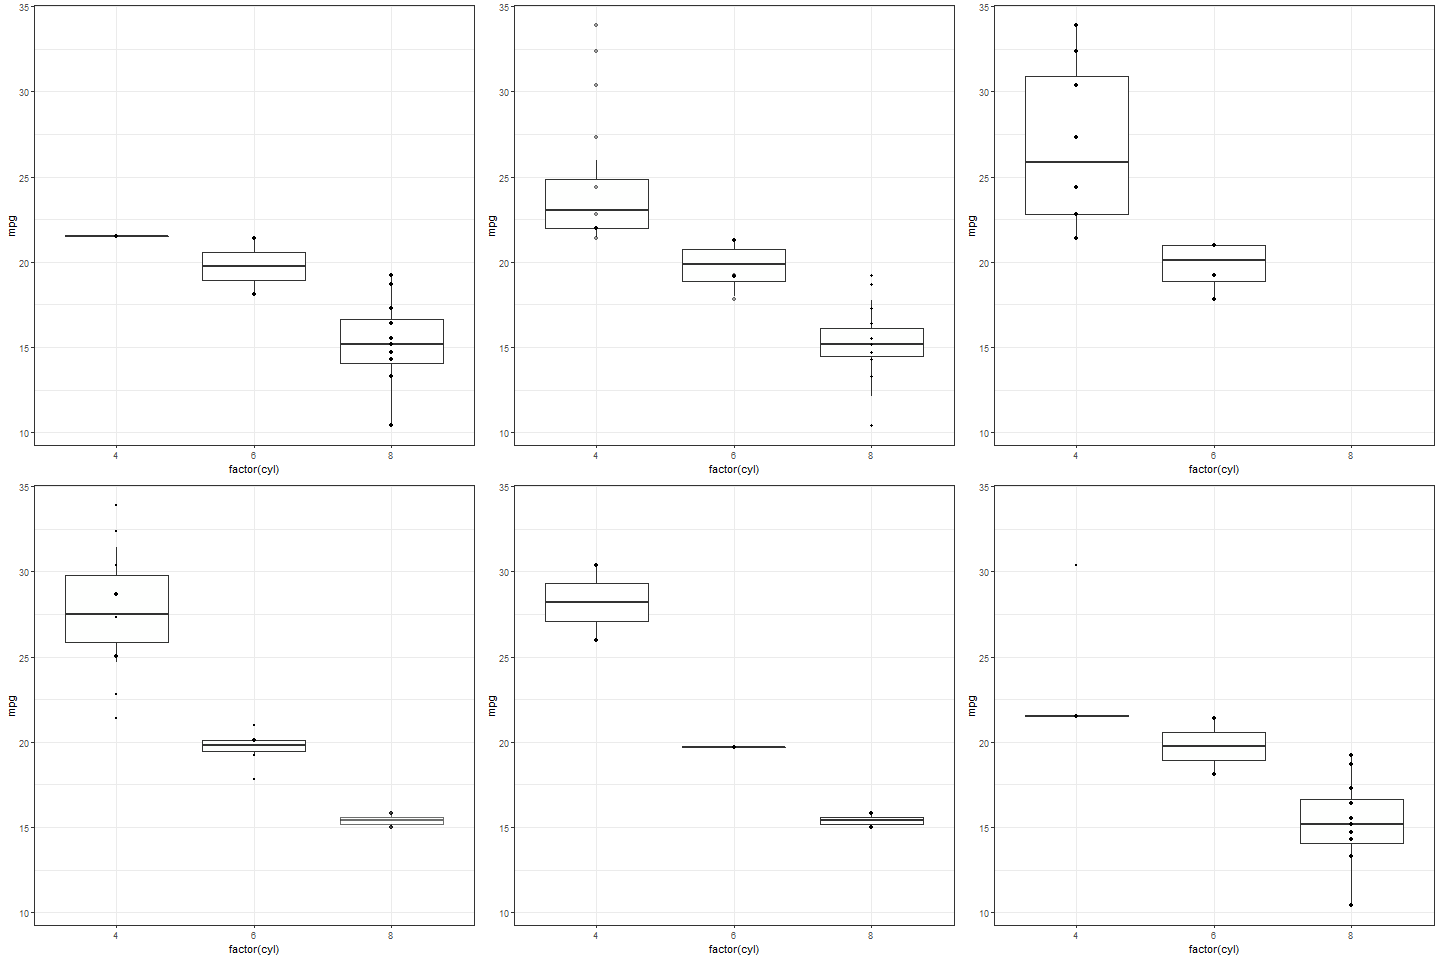
代码:
library(gapminder)
library(ggplot2)
library(gganimate)
theme_set(theme_bw())

##示例1 散点动态图
head(gapminder)
tail(gapminder)
ggplot(gapminder, aes(gdpPercap, lifeExp, size = pop, colour = country)) +
  geom_point(alpha = 0.7, show.legend = FALSE) +
  scale_colour_manual(values = country_colors) +        #进行数值之间的映射
  scale_size(range = c(2, 12)) +                    #设置绘图符号大小
  scale_x_log10() +                              #连续数据位置的标准化
  facet_wrap(~continent) +                     #按照continent进行分类
  # Here comes the gganimate specific bits
  labs(title = 'Year: {frame_time}', x = 'GDP per capita', y = 'life expectancy') +
  transition_time(year) +
  ease_aes('linear')#指数据变化的状态,线性发展比较缓慢


##示例2 箱线动态图

ggplot(mtcars, aes(factor(cyl), mpg)) +
  geom_boxplot() + geom_point() +
  transition_states(
    gear,
    transition_length = 2,
    state_length = 1
  ) +
  enter_fade() +
  exit_shrink() +
  ease_aes('sine-in-out')

