安装清华镜像站
site=”https://mirrors.tuna.tsinghua.edu.cn/CRAN”
安装稳定版(推荐)
install.packages(“ggalluvial”, repo=site)
# 加载包
library(ggalluvial)
# 转换内部数据为数据框,宽表格模式
titanic_wide <- data.frame(Titanic)
# 显示数据格式
head(titanic_wide)
#> Class Sex Age Survived Freq
#> 1 1st Male Child No 0
#> 2 2nd Male Child No 0
#> 3 3rd Male Child No 35
#> 4 Crew Male Child No 0
#> 5 1st Female Child No 0
#> 6 2nd Female Child No 0
tail(titanic_wide)
# Class Sex Age Survived Freq
# 27 3rd Male Adult Yes 75
# 28 Crew Male Adult Yes 192
# 29 1st Female Adult Yes 140
# 30 2nd Female Adult Yes 80
# 31 3rd Female Adult Yes 76
# 32 Crew Female Adult Yes 20
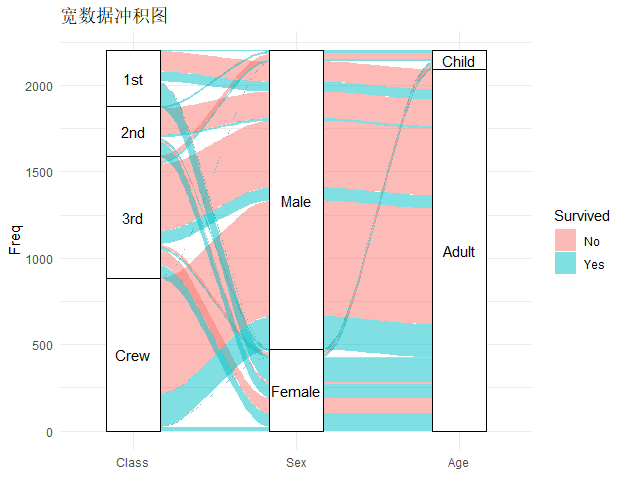
# 绘制性别与舱位和年龄的关系
ggplot(data = titanic_wide,
aes(axis1 = Class, axis2 = Sex, axis3 = Age,
y = Freq)) +
scale_x_discrete(limits = c("Class", "Sex", "Age"), expand = c(.1, .05)) +
geom_alluvium(aes(fill = Survived)) +
geom_stratum() + geom_text(stat = "stratum", label.strata = TRUE) +
theme_minimal() +
ggtitle("宽数据冲积图")
#geom_alluvium为冲击图组间面积连接并按生存率比填充分组,geom_stratum()每种有柱状图,geom_text()显示柱状图中标签,theme_minimal()主题样式的一种,ggtitle()设置图标题
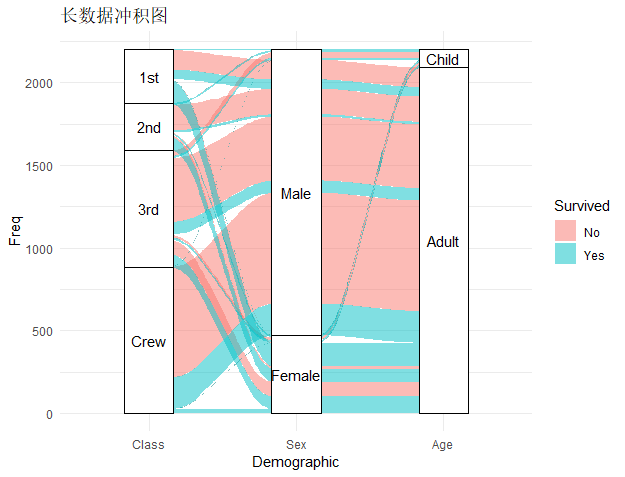
# 长表格模式,to_loades多组组合,将Class、Sex、Age列钻取为行,数据扩长3倍,会生成alluvium和stratum列。主分组位于命名的key列中
titanic_long <- to_lodes(data.frame(Titanic),
                         key = "Demographic",
                         axes = 1:3)
head(titanic_long)
#      Survived Freq alluvium Demographic stratum
# 1       No    0        1       Class     1st
# 2       No    0        2       Class     2nd
# 3       No   35        3       Class     3rd
# 4       No    0        4       Class    Crew
# 5       No    0        5       Class     1st
# 6       No    0        6       Class     2nd
> tail(titanic_long)
#       Survived Freq alluvium Demographic stratum
# 91      Yes   75       27         Age   Adult
# 92      Yes  192       28         Age   Adult
# 93      Yes  140       29         Age   Adult
# 94      Yes   80       30         Age   Adult
# 95      Yes   76       31         Age   Adult
# 96      Yes   20       32         Age   Adult
ggplot(data = titanic_long,
       aes(x = Demographic, stratum = stratum, alluvium = alluvium,
           y = Freq, label = stratum)) +
  geom_alluvium(aes(fill = Survived)) +
  geom_stratum() + geom_text(stat = "stratum") +
  theme_minimal() +
  ggtitle("长数据冲积图")
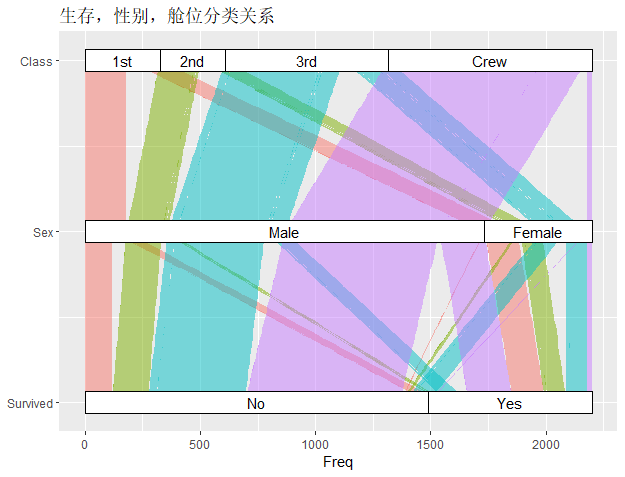
#按生存,性别,舱位分类查看关系,并按舱位填充色
ggplot(as.data.frame(Titanic),
       aes(y = Freq,
           axis1 = Survived, axis2 = Sex, axis3 = Class)) +
  geom_alluvium(aes(fill = Class),
                width = 0, knot.pos = 0, reverse = FALSE) +
  guides(fill = FALSE) +
  geom_stratum(width = 1/8, reverse = FALSE) +
  geom_text(stat = "stratum", label.strata = TRUE, reverse = FALSE) +
  scale_x_continuous(breaks = 1:3, labels = c("Survived", "Sex", "Class")) +
  coord_flip() +
  ggtitle("生存,性别,舱位分类关系")
# 定义一种冲积宽表格
head(as.data.frame(UCBAdmissions))
# Admit Gender Dept Freq
# 1 Admitted Male A 512
# 2 Rejected Male A 313
# 3 Admitted Female A 89
# 4 Rejected Female A 19
# 5 Admitted Male B 353
# 6 Rejected Male B 207
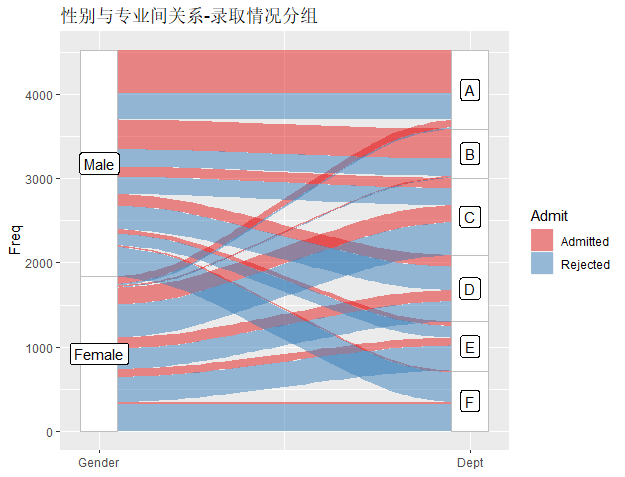
#查看性别与专业间关系,并按录取情况分组
ggplot(as.data.frame(UCBAdmissions),
aes(y = Freq, axis1 = Gender, axis2 = Dept)) +
geom_alluvium(aes(fill = Admit), width = 1/10) +
geom_stratum(width = 1/10, fill = "white", color = "grey") +
geom_label(stat = "stratum", label.strata = TRUE) +
scale_x_continuous(breaks = 1:2, labels = c("Gender", "Dept")) +
scale_fill_brewer(type = "qual", palette = "Set1") +
ggtitle("性别与专业间关系-录取情况分组")
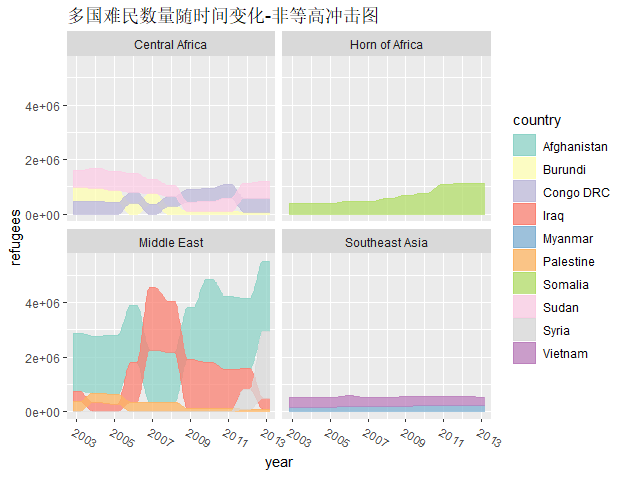
# 绘制非等高冲击图
# 以各国难民数据为例,观察多国难民数量随时间变化
data(Refugees, package = "alluvial")
country_regions <- c(
  Afghanistan = "Middle East",
  Burundi = "Central Africa",
  `Congo DRC` = "Central Africa",
  Iraq = "Middle East",
  Myanmar = "Southeast Asia",
  Palestine = "Middle East",
  Somalia = "Horn of Africa",
  Sudan = "Central Africa",
  Syria = "Middle East",
  Vietnam = "Southeast Asia"
)
Refugees$region <- country_regions[Refugees$country]
ggplot(data = Refugees,
       aes(x = year, y = refugees, alluvium = country)) +
  geom_alluvium(aes(fill = country, colour = country),
                alpha = .75, decreasing = FALSE) +
  scale_x_continuous(breaks = seq(2003, 2013, 2)) +
  theme(axis.text.x = element_text(angle = -30, hjust = 0)) +
  scale_fill_brewer(type = "qual", palette = "Set3") +
  scale_color_brewer(type = "qual", palette = "Set3") +
  facet_wrap(~ region, scales = "fixed") +
  ggtitle("多国难民数量随时间变化-非等高冲击图")
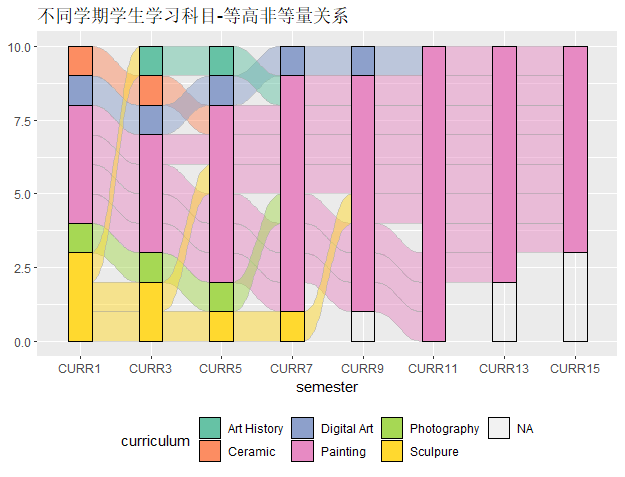
# 等高非等量关系
# 不同学期学生学习科目的变化
data(majors)
majors$curriculum <- as.factor(majors$curriculum)
ggplot(majors,
       aes(x = semester, stratum = curriculum, alluvium = student,
           fill = curriculum, label = curriculum)) +
  scale_fill_brewer(type = "qual", palette = "Set2") +
  geom_flow(stat = "alluvium", lode.guidance = "rightleft",
            color = "darkgray") +
  geom_stratum() +
  theme(legend.position = "bottom") +
  ggtitle("不同学期学生学习科目-等高非等量关系")